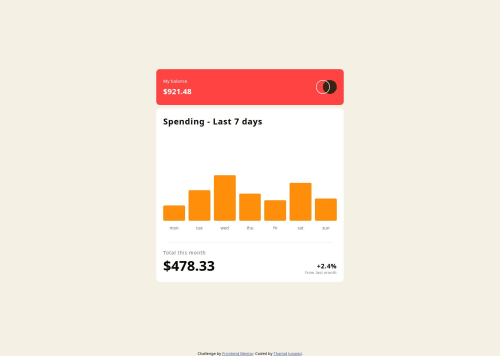
Dynamic Expense Chart(Data Loaded from JSON) using HTML, CSS and JS.

Solution retrospective
What am I most proud of? The fact that I pulled off a dynamic chart using vanilla JS and CSS. It was fun to work with vanilla JS because I usually work with React.
What I would do differently next time? I think the active sate(hover to show individual expenses) could be done better. So, I'm open to any suggestion.
What challenges did you encounter, and how did you overcome them?I tried to import JSON directly using import keyword.
import data from "./data.json" this line gives an error.
JavaScript module script but the server responded with a MIME type of "application/json"
Solved it using the following import.(with the help of internet)
import data from "./data.json" assert{type: "json"}
Learn More about Import Assertions here..
Please log in to post a comment
Log in with GitHubCommunity feedback
No feedback yet. Be the first to give feedback on Junaeid’s solution.
Join our Discord community
Join thousands of Frontend Mentor community members taking the challenges, sharing resources, helping each other, and chatting about all things front-end!
Join our Discord