Submitted over 2 years agoA solution to the Expenses chart component challenge
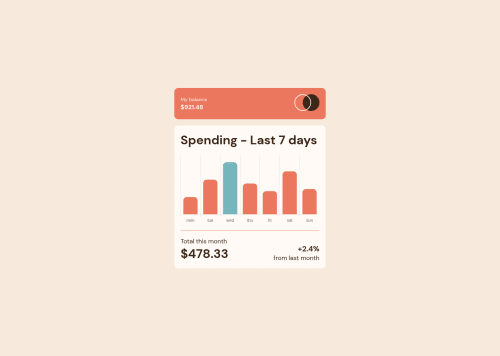
Expenses Chart Component using Vue, Chart JS, Pug & SCSS
accessibility, bem, chart-js, vue, sass/scss

@festsnusa
Solution retrospective
Hello everyone! It's my first time using Vue and ChartJS. My solution is obviously far from the initial design. So, here's my questions:
- First of all, I didn't quite figure out how to round the borders at the bottom of my each column. When I set it to "borderRadius: 10", ChartJS only rounds the top corners;
- Second, I didn't find any information how to hide separators between columns;
- And lastly, when you hover any column, you are able to see digits without dollar sign.
If anyone knows how to fix these problems, please write down in the comments section.
Thanks in advance!
Code
Loading...
Please log in to post a comment
Log in with GitHubCommunity feedback
No feedback yet. Be the first to give feedback on madhaus's solution.
Join our Discord community
Join thousands of Frontend Mentor community members taking the challenges, sharing resources, helping each other, and chatting about all things front-end!
Join our Discord