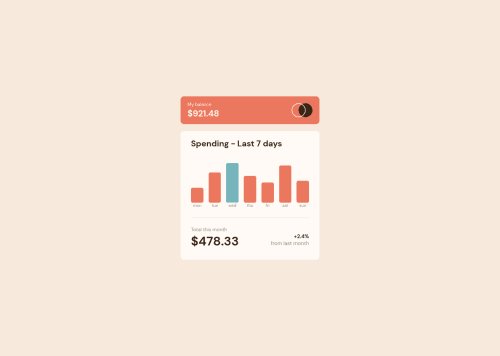
Expenses chart component - built with React, responsive Flex layout

Solution retrospective
I managed to successfully implement all of the main features, but what's the best solution to have the graph's bars height scale dynamically with the data from the JSON file? I figured a good way to get that working is to use percentages for the bars' height, with the % value being proportional to the biggest data point (determined using Math.max() with JS), which would always take up 100% height. I also added the bar legend hover element as a child of the actual bar <div> so that I could use "position: absolute" and "top: 0" to always have them show up above the bars, but I'm not sure if this is the best approach. Thanks!
Please log in to post a comment
Log in with GitHubCommunity feedback
No feedback yet. Be the first to give feedback on Lucca Rodrigues's solution.
Join our Discord community
Join thousands of Frontend Mentor community members taking the challenges, sharing resources, helping each other, and chatting about all things front-end!
Join our Discord