Submitted over 1 year agoA solution to the Expenses chart component challenge
Expenses chart component - or: my first Svelte + Chart.js project! :)
svelte, chart-js

@pinhob
Solution retrospective
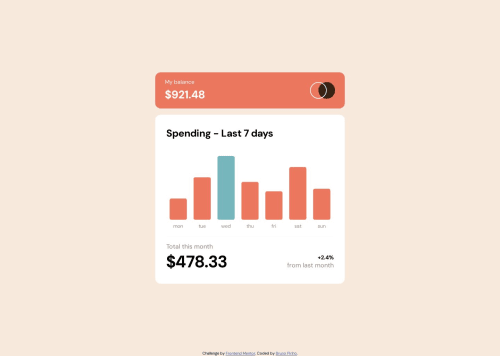
I had a lot of fun building this challenge using Svelte and Chart.js for the first time. 🤓
Compared with React, for example, which I use daily, coding with Svelte really feels more straightforward and closer to pure HTML + CSS + JS. Chart.js is also a great lib, although I need to search a lot to make the chart equal to the one in the challenge design - and, tbh, it's still not 100% accurate.
Any tip on how to improve the code or the way I handle things in Svelte is more than welcome! 🙂
Code
Loading...
Please log in to post a comment
Log in with GitHubCommunity feedback
No feedback yet. Be the first to give feedback on Bruno Pinho's solution.
Join our Discord community
Join thousands of Frontend Mentor community members taking the challenges, sharing resources, helping each other, and chatting about all things front-end!
Join our Discord