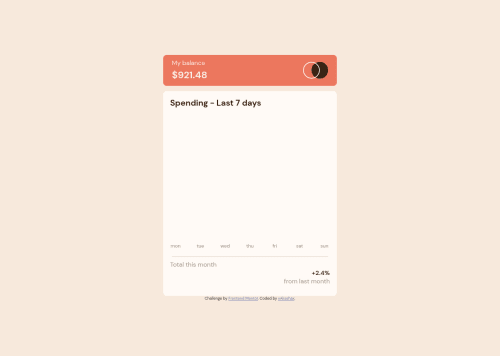
Expenses chart component using JS, interactive

Solution retrospective
This challenge took me a lot of time. I made it a little different. This project is not perfect. I didn't focus on the exact css copping. I did it interactive using the data from data.json. This way, if something changes in the data, it gets changed and mapped to the chart. I calculated the current amount for this month as a function and displayed it in the project. You can see hover states for interactive elements on the page, see the current day’s bar highlighted in a different colour to the other bars. When you click on a bar, it will be highlighted and its label with the amount will be displayed.
Any feedback is welcome!
Please log in to post a comment
Log in with GitHubCommunity feedback
- @xAkashax
Hello! Do you have any idea why the bars are not displayed in the preview? Everything works on the live server :(.
Join our Discord community
Join thousands of Frontend Mentor community members taking the challenges, sharing resources, helping each other, and chatting about all things front-end!
Join our Discord