Expenses Chart Component using Vanilla JS and CSS

Solution retrospective
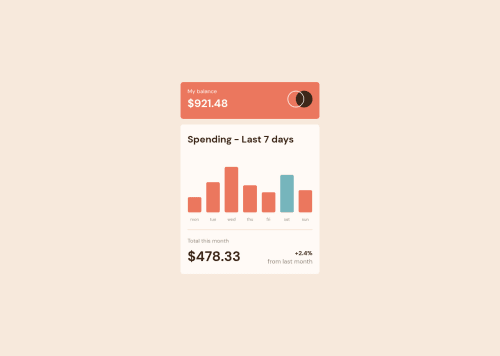
I am not sure if the manner in which I have added 'height' to the bars in the chart is correct. It worked for the given data but how can I ensure that the chart scales as the data scales?
Please log in to post a comment
Log in with GitHubCommunity feedback
- @arshGoyalDev
You have done it great
- It seems like your solution could work but you could use "%" instead of pixels.
- And to fix some of the accessibility issues you should either remove all of the ids you added in amount div or you could add them like
id="monday amount", id="tuesday amount"and more
- @devmor-j
Nice job 🎉 looks good and almost identical though I guess that cyan bar is supposed to be the max spending bar as shown in the design specs. Still not sure if this works but in your css file changing
.day.todayto sth like.day.maxmight be the fix (needs some js refactor as well):.day.max .bar { background-color: var(--clr-cyan); }then in your js file:
// try to come up with a logic here:
if (/* this bar is the max then add 'max' class to it */) {
    days[index].classList.add('max');
  }
Mobile and zooming and all works. Fonts and sizings are also great. Will be a great solution. Keep it up bro 😉


Join our Discord community
Join thousands of Frontend Mentor community members taking the challenges, sharing resources, helping each other, and chatting about all things front-end!
Join our Discord