Submitted almost 3 years agoA solution to the Expenses chart component challenge
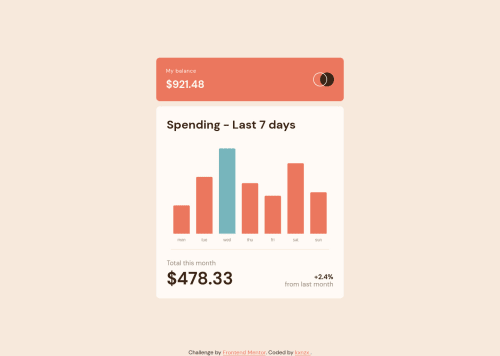
Expenses Chart Component with chart.js
accessibility, sass/scss, chart-js

@kxnzx
Solution retrospective
What I learned:
Working on this solution was a great way for me to learn more about JavaScript. I created the vertical bar graph with Chart.js and customized the chart in JavaScript. I placed the chart in a canvas tag in HTML:
<canvas id="chart" width="300" height="200"> </canvas>
I also learned a bit about Data Types:
- Strings: "Hello World" "Total:" "A"
- Numbers: 10 1.5 -30 1.2e10
- Boolean: true false
- null: null These are combinations of the above:
- Arrays [1,2,3] ["Hello","World"]
- Objects { "key":"value" } { "age": 30 }
Code
Please log in to post a comment
Log in with GitHubCommunity feedback
No feedback yet. Be the first to give feedback on kxnzx's solution.
Join our Discord community
Join thousands of Frontend Mentor community members taking the challenges, sharing resources, helping each other, and chatting about all things front-end!
Join our Discord