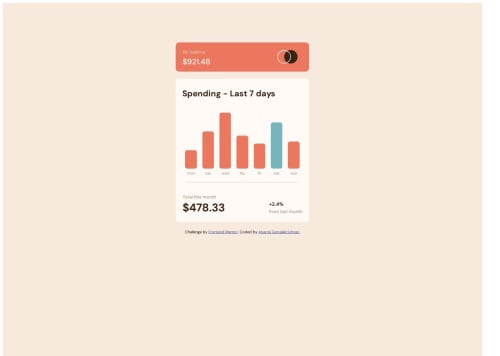
Expenses Chart using HTML,CSS,JS and Google Charts

Solution retrospective
I am a beginner in HTML, CSS and Javascript. When I took on this challenge, I didn't expect it to be this tough to complete. Maybe the solution approach (using Goole Charts) that I took might have made it so.
What challenges did you encounter, and how did you overcome them?I found it extremely difficult to customize the Google chart to make it like the expected solution. I mainly depended on Stack Overflow to find the answers for that.
What specific areas of your project would you like help with?I need help to understand how to make my code more responsive so that it looks good in different devices. Also I would like to understand how to draw dynamic charts using an easier design.
Please log in to post a comment
Log in with GitHubCommunity feedback
No feedback yet. Be the first to give feedback on Aparnagopal's solution.
Join our Discord community
Join thousands of Frontend Mentor community members taking the challenges, sharing resources, helping each other, and chatting about all things front-end!
Join our Discord