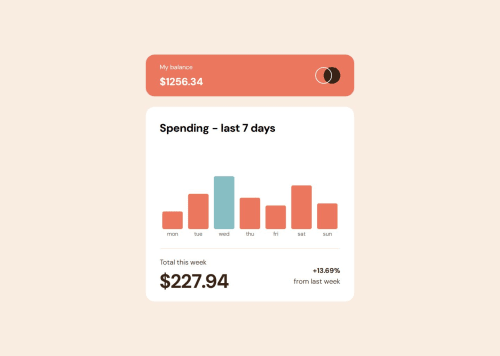
Expenses chart with React & recharts

Solution retrospective
I've investigated into 'recharts' library for building modern charts, it was kinda hard to implement my solution exactly the same as on photo, but seems like I succeeded)
What challenges did you encounter, and how did you overcome them?Absolutely new library for me, had to research documentation
Please log in to post a comment
Log in with GitHubCommunity feedback
- @MarziaJalili
Next level! 🔥
🤔 Instead of always highlighting Wednesday, wouldn’t it make more sense to highlight the current day? You can easily achieve this using the DayJS library.
Here’s how:
✅ First, import DayJS and use it to get the current day name:
import dayjs from 'https://unpkg.com/dayjs@1.11.10/esm/index.js';

const today = dayjs().format("dddd"); // This gives you the current day name
✅ Then, define your list of weekdays and get all the related DOM elements:
const weekDays = [
  "Monday",
  "Tuesday",
  "Wednesday",
  "Thursday",
  "Friday",
  "Saturday",
  "Sunday"
];

const elements = document.querySelectorAll("same-name-applied-to-all-elements");
✅ Finally, loop through the days and add a .today class to the matching element:
weekDays.forEach((day, index) => {
  if (day === today) {
    elements[index].classList.add("today");
  }
});
This way, the correct day will be highlighted automatically based on the actual date.
Give it a go — it'll definitely click! 👊

Join our Discord community
Join thousands of Frontend Mentor community members taking the challenges, sharing resources, helping each other, and chatting about all things front-end!
Join our Discord