My solution to the expenses chart component challenge

Solution retrospective
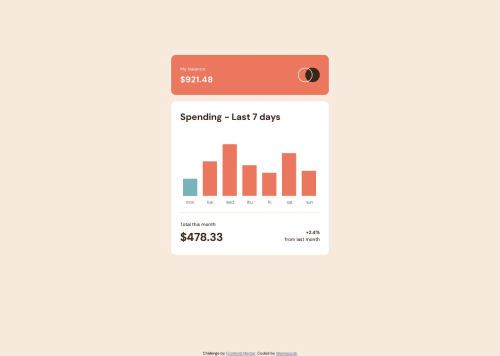
Hello all. This is my code for the Expenses Chart Component Challenge. I used chart.js for the chart.
The HTML, I'm not sure about the semantics/accessibility for a component. It didn't completely satisfy the browser's WAI-ARIA plugin. The CSS, nothing much here, just the usual with use of clamp for certain things. For the JS, it's mostly because of Chart.js.
Since there was a JSON file included with the challenge, to fill the labels and dataset I mapped it into an array through an async/await block (including the colors, and hover colors). Now, there was the condition of, "See the current day’s bar highlighted in a different colour to the other bars", for this I consulted StackOverflow where I found this post, Day Name from Date in JS. The code is...
const today = new Date().toLocaleDateString('en-US', {weekday: 'short'}).toLowerCase();
/*
  other code in between
*/
const dayColors = datapoints.map(
  function(index){
    return index.day === today ? 'hsl(186, 34%, 60%)': 'hsl(10, 79%, 65%)';
  });
const hoverDayColors = datapoints.map(
  function(index){
    return index.day === today ? 'hsl(186, 47%, 80%)': 'hsl(10, 100%, 76%)';
  });
Now, depending on what day of the week it is, one will see that the current day's bar will be a different color from the others (as well as the hover colors).
Please log in to post a comment
Log in with GitHubCommunity feedback
No feedback yet. Be the first to give feedback on wannacode's solution.
Join our Discord community
Join thousands of Frontend Mentor community members taking the challenges, sharing resources, helping each other, and chatting about all things front-end!
Join our Discord