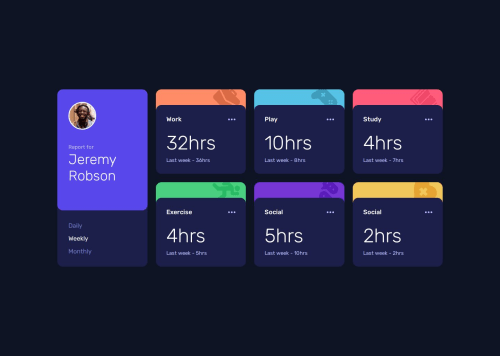
Time Tracking Dashboard 🫡

Solution retrospective
I'm happy with the animations and how they turned out. I might have changed how I handle populating the data for current and previous times on each card.
Currently, this is how I'm doing it:
const populateDashboard = (data, time) => {
    for (let i = 0; i < data.length; i++) {
        const { current, previous } = data[i].timeframes[time];
        currentStats[i].textContent = `${current}hrs`;
        previousStats[i].textContent = `${previous}hrs`;
    }
}
As long as the data is all in order, then this should work.
What challenges did you encounter, and how did you overcome them?A challenge with styling was the background colors for each card. I had to set the parent container for each card to
position: relative;
and then have a background div set to
position: absolute;
border-bottom-right: 2rem;
border-bottom-left: 2rem;
Additionally, I set bottom border radius to twice that of the container's border radius so that I wouldn't see the corner of the background div.
What specific areas of your project would you like help with?I'd like any suggestions on how to populate the cards data a better way if possible, thanks!
Please log in to post a comment
Log in with GitHubCommunity feedback
No feedback yet. Be the first to give feedback on Josh Kahlbaugh's solution.
Join our Discord community
Join thousands of Frontend Mentor community members taking the challenges, sharing resources, helping each other, and chatting about all things front-end!
Join our Discord